Introduction
Historically, life care planners have researched and directly obtained charges for services and procedures from local vendors, providers, and facilities in specific geographic locations as a primary costing technique. With time, additional resources and means to obtain cost data have emerged (Holakiewicz & Pacheo, 2012; C. B. Johnson et al., 2023; Neulicht et al., 2010). Today’s life care planners may use a combination of sources (C. B. Johnson et al., 2023). Recent studies show that they commonly use
-
Databases
-
Telephone surveys (Owen et al., 2021; Pomeranz & Yu, 2022)
-
Medical bills
-
Price transparency data (Barros-Baily, 2024)
-
Professional association standards of practice (International Academy of Life Care Planners [IALCP], 4th ed., 2022; American Association of Nurse Life Care Planners [AANLCP], 1st ed., 2015)
-
Consensus and Majority Statements (C. Johnson et al., 2025; C. B. Johnson et al., 2018)
Additional cost-related resources for costing techniques can be found in Chapter 3.
Chapter 6 presents a qualitative analysis from a 2021 online Survey Monkey© survey. This chapter includes methods and procedures, themes and definitions, and study limitations. The results provide a better understanding of techniques used in life care plan costing decisions and suggest recommendations for future research.
Background
In the 1980’s, before technological advances, the primary method for obtaining life care planning costs was by speaking to providers and facilities about their charges for services and procedures (Holakiewicz & Pacheo, 2012). While the degree of reliance on this method may have evolved over time, its use has persisted. The 2009 Life Care Plan Survey found that respondents preferred obtaining costs from current vendors followed by local vendors/providers in the geographic area (Neulicht et al., 2010). One method of obtaining surgery costs included calling hospital price lines (Woodard et al., 2017). Also, approximately 77% of respondents considered telephone calls to specific providers and vendors as being a valid method for determining life care plan costs in a specific geographic area (C. B. Johnson et al., 2023). In addition, Johnson and Woodard (2022) provided an historical timeline regarding costing techniques and methods in life care planning.
Life care planners now can use more methods. For example, Johnson et al. (2023) confirmed that many life care planners use a combination of sources, such as published databases (Owen et al., 2021; Pomeranz & Yu, 2022). Barros-Bailey (2024) reported the following sources:
-
Current vendor and providers
-
Local vendors and providers
-
Internet
-
National databases with geographic adjustment
-
Medical bills
-
Manufacturers
-
Life care planner’s office cost file or database
-
Price transparency data published by hospitals
-
Catalogs
Also, life care planners were more likely to use personal contacts to obtain home care and facility care costs (Barros-Bailey, 2024).
IALCP, the life care planning section of the International Association of Rehabilitation Professionals (IARP), published the first Standard of Practice for Life Care Planners in 2000, which were updated in 2009, 2015, and 2022 (Rutherford-Owen et al., 2024). Gamez et al. (2017) found that having a planning process in life care planning was also consistent in the American Association of Nurse Life Care Planner (AANLCP) Standards of Practice (SOP) (2015) and the American Academy of Physician Life Care Planners (AAPLCP) SOP (2014). Most recently, the 4th edition of the IALCP Standards of Practice (2022) provided standards for the process of determining future care recommendation costs, encouraging life care planners to use a “consistent, valid, and reliable approach to costs” (IALCP, 2022, Standard 14). These standards also included the use of verifiable and geographically representative costs, the use a of a consistent method to organize and interpret costing data, and the identification of services and products from reliable sources (IARP, 4th ed., 2022).
Similar to published standards, published Consensus and Majority Statements have been developed and repeatedly revised for more than two decades through the work of summit participants using consensus research methods such as the nominal group technique (NGT), audience response system (ARS), the Delphi technique, and online platforms such as Mentimeter to reflect “agreed upon best practices” used by life care planners (C. Johnson et al., 2025; C. B. Johnson et al., 2023; Owen et al., 2024). These statements address cost-related topics. Johnson et al. (2025) noted that this process reported the following criteria for best practices:
-
Verifiable data from appropriately referenced sources
-
Costs are geographically specific when appropriate and available
-
Include non-discounted/market rate prices
-
More than one cost estimate, when appropriate
Rationale and Purpose for This Project
The research methodology for this project was analyzing additional responses found in the 2021 Life Care Planning Costing Technique Survey to gain insights into life care plan costing and assist with the development of a Costing Framework. At the May 2017 Life Care Planning Summit, attendees agreed that “life care planners would develop a position statement (white paper) providing guidance for charges and/or costs presented in a life care plan” (Albee et al., 2017, p. 26). To accomplish this goal, a survey was disseminated to life care planners through SurveyMonkey© regarding their costing techniques. Responses were collected from November 9, 2021 to December 21, 2021.
After December 21, 2021, a quantitative analysis was undertaken. Johnson et al. (2023) presented these findings at the 2022 Life Care Planning Summit then published the results (See Chapter 5). No qualitative analysis of responses in the “Other” category or to open-ended questions in the survey was conducted. Attendees at the 2022 Summit requested the development of a Costing Framework to inform life care planning costing processes. Identifying themes in the 2021 Survey qualitative data was the first step in this process. A review of those additional responses was conducted to identify themes about costing techniques life care planners used and to define variables they considered in making cost decisions.
This project involved elements of both qualitative and quantitative data collected as a precursor to summit proceedings. Also, this project is a part of the overall Costing Framework project. The National Institutes of Health definition for mixed method research (Creswell et al., 2011) was used as a guideline for this project’s process as well as the overall Costing Framework project.
Methods
Survey Participants
From November 9, 2021 to December 21, 2021, 264 life care planners voluntarily responded to an online SurveyMonkey© survey of 62 questions. The participants were told that their responses would help develop guidance and determine trends in costing techniques. Responses would also potentially generate topics for the Life Care Planning Summit in Dallas to be held on May 13 and 14 2022 (C. B. Johnson et al., 2023).
Confidentiality was maintained through SurveyMonkey©. Participants were self-selected; no individually identified or collective demographic information (e. g., age, education, or type of practice milieu) was collected. Since there was minimal risk of harm to participants, the Institutional Review Board (IRB) was waived. Participants were informed that results were intended for publication and no participant compensation was offered.
More than 39% of survey participants had practiced life care planning for 20+ years, while 64% had practiced for over 10 years. The majority (64%) were certified life care planners and 22% reported completing 21 to 40 life care plans each year with 7.58% completing more than 100 life care plans per year. Participants practiced throughout the United States (U.S.) including all 50 states, D.C., and Canada with approximately 37% submitting plans in Florida and 35% submitting plans in Texas. Through quantitative analysis of the survey data, as seen in Chapter 5, we found that survey respondent sample encompasses life care planners of varying experience, certification status, and geographic practice. See Chapter 5 for additional participants’ details.
Project Procedure
In February 2023, 9 members volunteered to analyze the additional qualitative responses, with two co-chairs. Two subcommittee members withdrew before analysis was complete. Subcommittee members unanimously voted for a quorum to consist of at least four members during the scheduled meetings for a total of 44 virtual meetings. Additional communication between subcommittee members was accomplished via email.
The Survey Subcommittee chose to use thematic analysis, a research method used to identify and interpret patterns or themes in qualitative data to provide further insights and understanding (Boyatzis, 1998; Elliott, 2018; Thomas, 2006). Keywords and short phrases that occurred in the “Other” answer category or open-ended responses were identified and subsequently organized into meaningful categories. Themes that appeared regularly in responses were recorded as response theme frequencies in a spreadsheet.
Subcommittee members reviewed all questions and additional responses found either in the “Other” category or open-ended responses. Results of the quantitative analysis of the 2021 Survey can be found in Chapter 5. For the additional responses, there were no specific answer choices to select; thus, open-ended responses were reviewed for the following 17 questions:
Q11. How did you learn how to research costs for services and products recommended in a life care plan? (35 responses)
Q12. When you are developing a life care plan, how do you define associated costs? (239 responses)
Q17. If you use fee information shared with you in telephone calls to providers as a source of costs for your life care plans, how do you record this information? (23 responses)
Q24. If you do not use any of the terms in Questions 16 through 21, what term do you use? (73 responses)
Q16 Do you consider e-mail correspondence with specific vendors a valid method of determining the cost of services in a specific geographic area? Answer choices were None of the above, Yes, or No.
Q17 If you use fee information shared with you in telephone calls to providers as a source of costs for your life care plans, how do you record this information? Answer choices were None of the above, Handwritten notes, Electronic database, e.g., spreadsheet, Word processing document, Directly into report, and Other (please specify).
Q18 This question is for those who make telephone calls or write e-mail letters to providers to determine costs for medical services: For what percentage of the life care plans that you write do you use the term “billed amount” when requesting information? Participants provided answers.
Q19 This question is for those who make telephone calls or write e-mail letters to providers to determine costs for medical services: For what percentage of the life care plans that you write do you use the term “self pay” when requesting information? Participants provided answers.
Q20 This question is for those who make telephone calls or write e-mail letters to providers to determine costs for medical services: For what percentage of the life care plans that you write do you use the term “private pay” when requesting information? Participants provided answers.
Q21 This question is for those who make telephone calls or write e-mail letters to providers to determine costs for medical services: For what percentage of the life care plans that you write do you use the term “non discounted” when requesting information? Participants provided answers.
Q22 This question is for those who make telephone calls or write e-mail letters to providers to determine costs for medical services: For what percentage of the life care plans that you write do you use the term “uninsured rate” when requesting information? Participants provided answers.
Q23 This question is for those who make telephone calls or write e-mail letters to providers to determine costs for medical services: For what percentage of the life care plans that you write do you use the term “charge” when requesting information? Participants provided answers.
Q40. This question is for those who use a database as a source of cost information for their life care plans. Which percentile do you use to represent costs? (45 responses)
Q41. Regarding the previous question, why do you use this percentile to represent costs? (191 responses)
Q43. If you do not use a database, which of the following do you use to present costs of specific services and products? (21 responses)
Q44. What are some common problems that you encounter when researching costs for a life care plan? (195 responses)
Q45. Please indicate if you have current paid subscriptions to, or have paid to download, any of the following databases: Choices were None of the Above, Fair Health, American Hospital Directory, Context 4 Healthcare, Find-a-Code, PMIC Medical Fees, Wasserman’s Physicians Fee Reference, IBM Micromedex Red Book, Med Data, and Other (please specify). (50 responses)
Q47. Regarding Question 43, why did you choose the particular databases that you did for cost information? This question referred to Question 45, not 43 (190 responses)
Q48. Which of the following free sources of cost information do you use? Choices were None of the above, Fair Health Consumer, Health Care Blue Book, Price Point, Healthcare Cost and Utilization, Genworth Cost of Care, Cost Helper, Clear Health Costs, Milliman, Veterans Disability Compensation, Veteran’s Administration Reasonable, Fixr.com, GoodRx, Rxpricequotes.com, Wellrx.com, and Other (please specify) (32 responses)
Q49. Why did you choose the particular free sources of cost data that you chose? Please provide an answer for each free database that you used. (189 responses)
Q54. On which of the following collateral sources of funding do you rely to determine costs for a life care plan? (25 responses)
Q55. How current do prices need to be for you to consider them valid? (16 responses)
Q60. How many times has your testimony regarding the costs contained in a life care plan been challenged in a motion in limine? (30 responses)
Q61. How many times were you excluded from testimony as a result of such a motion? (11 responses) Responses included none and N/A with two open-ended responses “one time partially limited pending MD testimony,” and “one section of LCP because retaining attorney did not submit a medical expert report in federal court.”
Q62. Please use this space to share any other ideas that you may have about the methodology that life care planners use to determine costs: (102 responses)
The Survey Subcommittee unanimously voted to use thematic analysis to identify and present recurring patterns or themes in the additional responses found in the “Other” category or open-ended responses of the 17 questions, as noted above. Then, the subcommittee organized the key words and short phases into meaningful categories and placed this information into electronic notecards for review by subcommittee members to identify themes. The qualitative responses and response elements from each of the 17 questions were coded into six theme categories. The themes that emerged from this process were:
-
aggregated data
-
individual research (non-aggregated data)
-
learning techniques
-
practice management
-
problems encountered (challenges)
-
standards of practice / consensus statements
Multiple responses from a single participant were counted in their respective multiple categories. In addition, strengths (Table 18) and considerations for challenges or problems encountered (Table 19) were identified within the qualitative responses and are presented in the Results section.
Rules for Analysis
The following rules were agreed upon to analyze qualitative responses. First, responses that were confusing or ambiguous were tallied under an “ambiguous/unclear” column. Examples of these responses include “This question is not clear”, “I am not sure what you mean”, and “Anything that would be affected by the injury”, and “by need.” Responses that did not seem to match the question but matched a voted theme were tallied under the matched theme.
For an individual response containing multiple, duplicate repeats of the same idiosyncratic words or phrases in repeating responses, one of the answers was tallied under identified theme(s), and the others were placed under a “duplicative” column on the spreadsheet to indicate components of that response which were repeated without adding meaningful additional data. An example of a duplicative response was “non-discounted & geographically available to the evaluee now & in the future” reported five times, one after the other, under the same question. According to the voted rules, one response was tallied under theme(s), but the other four responses were categorized as duplicative.
Lastly, a “not used” category was used to identify any responses that did not match the identified themes such as “N/A”, “?”, “yes”, and “Xx.” No data was ignored. The “other” category during analysis included duplicative responses not tallied under themes and ambiguous/unclear responses.
During the virtual meetings, members discussed the qualitative responses and the elements of each response. Except as noted above, these were coded into six non-mutually exclusive themed categories. Also, elements within a single response could be tallied into multiple categories. This aimed to build a better insight and understanding of the data.
Once the analysis was completed, the subcommittee reviewed and unanimously agreed upon definitions for each of the six identified themes. The definitions were based on the synthesis of responses analyzed. In addition, potential strengths and challenges (formerly identified as problems encountered) when using various costing techniques were considered by the subcommittee by identifying direct statements from participants’ qualitative responses. A strength was subjectively defined by the subcommittee as a benefit for using a costing technique, whereas a challenge was defined by the subcommittee as a consideration when using a costing technique. Identified strengths and considerations (challenges) are presented in the Results section. These considerations were also used in the development of the Costing Framework. Along with the synthesis of findings from Chapter 5, 7, and 8, identified themes in this chapter were also used to create the Costing Framework that is presented in Chapter 9.
Results
Themes and Definitions
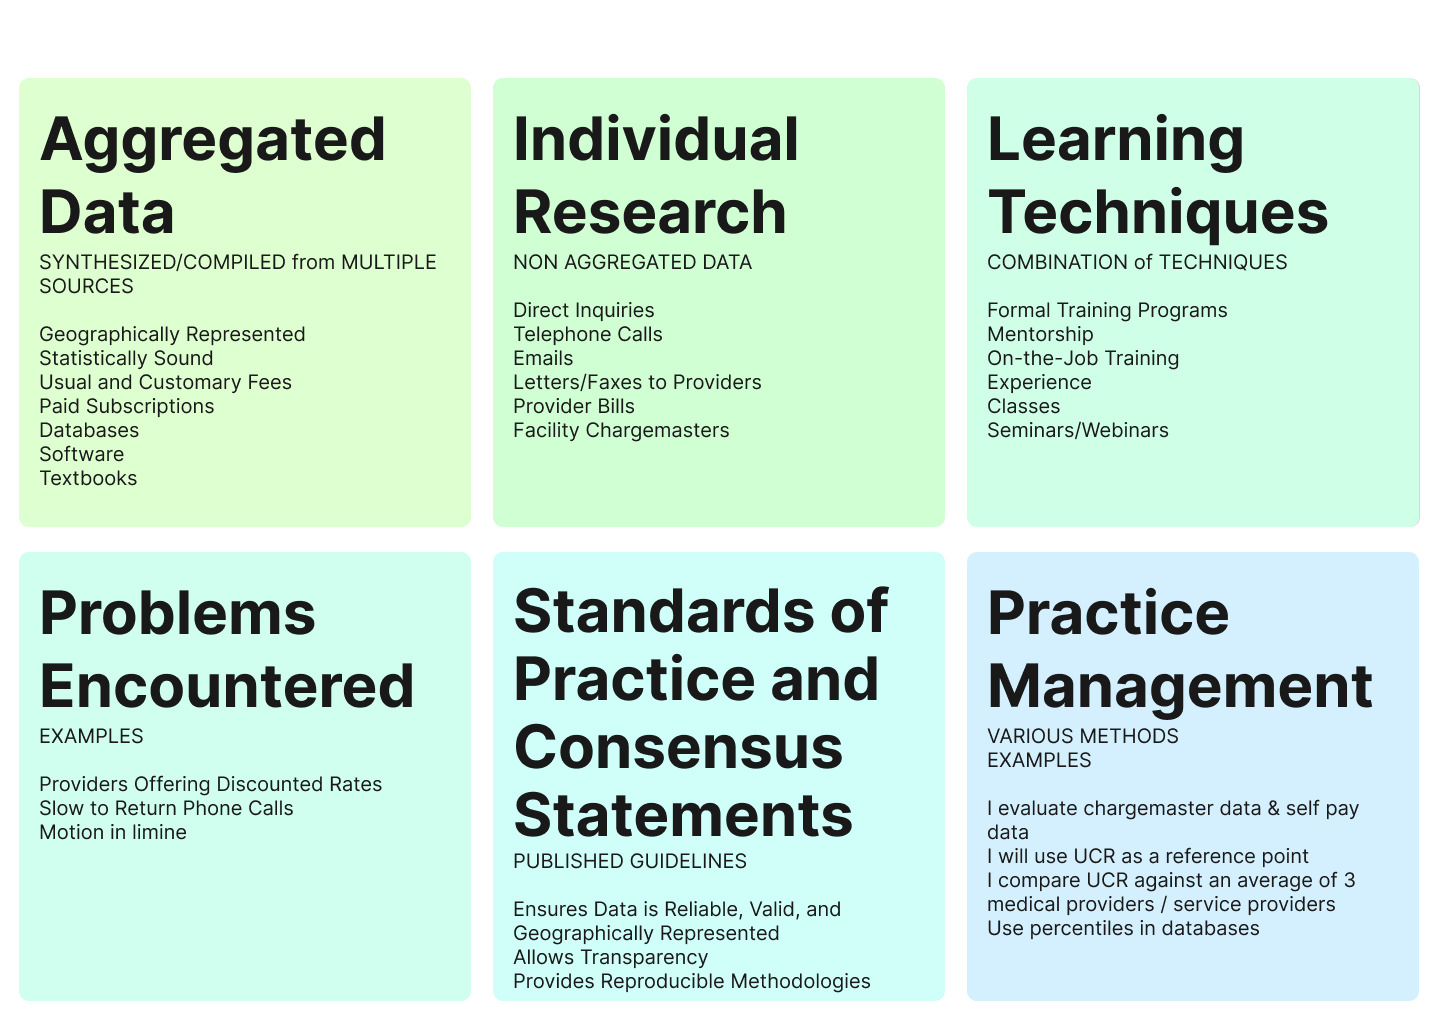
Once we completed the analysis, we reviewed theme definitions based on the responses and agreed on the following final theme definitions:
Theme 1: Aggregated Data
Definition: Aggregated data in life care planning refers to cost information that is synthesized and compiled from multiple sources. This data may be geographically representative. This data is considered statistically sound and provides options for usual and customary fees for services, supplies, and medical equipment, supporting comprehensive, valid, and reliable cost estimations.
Theme 2: Individual Research (Non-Aggregated Data)
Definition: Individual research in life care planning refers to cost information that is gathered individually and is not from synthesized and aggregated sources. This type of data can be derived from direct inquiries such as telephone calls, emails, and letters to providers, as well as independent research and provider bills. Facility chargemasters and direct vendor contacts are also sources of this type of data. This geographic specific data is considered to be valid and reliable cost estimations.
Theme 3: Learning Techniques
Definition: Learning techniques in life care planning encompass the various methods life care planners use to acquire skills in cost research. These can include formal training programs, mentorship, on-the-job training, classes, seminars, or a combination of techniques. This allows planners to adapt and refine their methods over time.
Theme 4: Problems Encountered
Definition: Researching costs for life care plans can have challenges as reported by (C. B. Johnson et al., 2023). For example, some costs are more difficult to research and identify such as charges for surgical procedures and hospitalizations. Some difficulty regarding return phone calls from providers was reported. Other problems reported included use of terms such as self-pay, private pay rate, or cash price when inquiring about non-discounted costs and providers giving discounted rates. These responses revealed considerations or challenges reported when using costing techniques and were summarized in Table 19.
Theme 5: Standards of Practice and Consensus Statements (SOP/CS)
Definition: Standards of practice in life care planning refer to the published guidelines that ensure data used is reliable, valid, and geographically representative. These standards allow transparent, reproducible methodologies, helping to maintain the integrity of life care plans. Consensus majority statements reflect agreed-upon best practices used by practicing life care planners in their daily work (C. B. Johnson et al., 2018).
Theme 6: Practice Management
Definition: Practice management in life care planning involves the diverse, individualized approaches life care planners use to research and document costs and practice ethically. Life care planners use clinical judgment when making cost decisions such as they choose to use specific resources, costing techniques, percentiles, and chargemasters, while adhering to standards of practice, life care planners employ various methods to support that their costs are valid, reliable, and reproducible.

Discussion
The purpose of this project was to analyze additional responses found in the 2021 Life Care Planning Costing Technique Survey and to find themes revealing insight into costing techniques life care planners use as well as variables they considered in making cost decisions. Findings from the analysis were also to assist in the creation of a Costing Framework. Thematic analysis was used to identify themes in participants’ responses found in the “Other” answer category or open-ended responses in the 2021 Survey. Six themes, aggregated data, individual research, learning techniques, practice management, problems encountered, and standards of practice / consensus (majority) statements, were identified when life care planners responded to questions about costing techniques in their practices and variables considered in making life care plan cost decisions. The themes from this project were synthesized along with additional findings in Chapter 5, 7, and 8 to develop the Costing Framework. Problems encountered (challenges) found in Chapter 6 as a distinct thematic category was synthesized to be included with other challenges reported in Chapters 5 and 7 and did not remain as a separate thematic category when developing the Costing Framework.
Use of aggregated data, synthesized data from multiple sources, was commonly reported. This common occurrence was revealed in questions such as Q12 when asked how associated costs were defined; Q45 when indicating if the respondent had current paid subscriptions or had paid to download any of the databases; and Q47 regarding the choice of particular databases. Respondents reported that they used paid databases because they were able to obtain geographically specific data that was verifiable and valid. Costs from databases were reported to be reliable, statistically sound, and reproducible. Life care planners also reported databases to be consistent with billed charges by providers, available, and defensible.
Similarly, aggregated costs obtained from textbooks was also reported to be statistically sound and reliable with access for geographically specific costs. In addition, use of databases and software as well as textbooks/publications were reported when life care planners were learning how to research costs for services and provided recommendations in life care plans. Of responses to Q54 inquiring about collateral sources of funding to determine costs, 20% of the total themes mentioned included aggregated data as a theme (Table 13). Similarly, in Q41 responses (Table 6), 22% of the total themes mentioned contained an aggregated data theme when describing the percentile they used to represent costs.
Furthermore, participants’ responses indicated that standards of practice and consensus (majority) statements help to guide life care planning decisions. In Q45, 38% of all themes reported included standards of practice / consensus (majority) statements as a theme when using paid subscriptions and databases as well as 31% when answering the reason why a particular database was chosen. Also, practice management skills based on the life care planner’s education, training, and experience along with clinical judgement when making costing decisions in their life care planning practice was revealed as a theme such as (33%) in Q47 (Table 10) and 35% in Q43 (Table 7).
Additionally, respondents indicated that they used free sources to assist when triangulating costs. Participants reported strengths of using free sources to include easily accessible, no expense, reliable, valid, providing multiple sources for costs, access to geographically specific costs, and reproducible. Two additional themes, use of standards of practice / consensus (majority) statements and practice management, were also commonly reported when using free databases.
Individual research was another costing technique commonly reported. In Q43 (Table 7), participants revealed individual research as a theme (23%), indicating how participants reported cost information during telephone calls. Also, in Q43, participants indicated use of individual research when questioned which technique was used to present costs of specific services and products when not using a database. Sending emails as follow up to providers, requesting written confirmation, or verification of cost via email or fax following the phone calls were reported. Life care planners reported using various practices to record information obtained from phone calls. Documentation included information about the sources, and with a range of costs, taking an average of costs obtained was used to report costs for items and services in a life care plan. Also, source information was reported in the life care plan or available in the working file. In addition, two themes, standards of practice / consensus (majority) statements and practice management were consistently revealed in Table 7, 37% and 35% respectively of total response elements when respondents reported to not use a database.
In this survey, respondents were asked to define associated costs, which is in the definition of a life care plan,
A Life Care Plan is a dynamic document based upon published standards of practice, comprehensive assessment, data analysis, and research, which provides an organized, concise plan for current and future needs with associated costs, for individuals who have experienced catastrophic injury or have chronic health care needs. (National Association of Rehabilitation Professionals in the Private Sector [NARPPS], 1998 as cited in Weed & Rutherford Owen, 2024, p. 9).
Some respondents were not sure about what the term “associated costs” and these responses were indicated under Other category. However, learning techniques (48%) and use of standards of practice/consensus (majority) statements (31%) as represented in Table 2 Q12 were the top two themes reported when respondents defined associated costs.
In addition, standards of practice/consensus (majority) statements and practice management themes were consistently found in other qualitative responses to questions. For example, practice management (58%) and standards of practice / consensus (majority) statements (17%) were found in Table 14 Q55 when discussing how current prices needed to be valid as well as in Table 5 Q40 respondents answered to the percentile they use to represent costs revealing standards of practice / consensus (majority) statements (36%) and practice management (37%). Also, in Table 17 Q62 when discussing methodology life care planners use to determine costs, use of standards of practice / consensus (majority) statements and practice management skills was consistently revealed.
Limitations
This qualitative study explored meanings and processes when life care planners were asked about costing techniques in their practices. The results of this project also provided findings to assist with the creation of a Costing Framework. However, it does not determine cause-and-effect relationships since qualitative studies focus on understanding meaning and context rather than establishing relationships using control groups and manipulating variables. Also, findings reflected the experiences of participants who responded to the 2021 Survey, and this cross-sectional approach in the life care planning community may be affected by response bias.
Future Research
One gap found in the findings of this project was the need for additional research regarding costing techniques used by life care planners practicing outside of the U.S. In analyzing responses in the 2021 Survey, some of the questions were reported to apply to this population, while other questions were reported not to apply. For example, responses indicated “differences in terminology between the US and Canada”, the use of databases including use for percentiles to represent costs, and the use of free sources were reported not applicable to the practice in Canada. In addition, collateral sources were reported as “not applicable in Canada” and motions in limine were reported to not be used in Canada.
The results of this project provided data that can assist with formulating plausible hypotheses for further investigation. While the presence of these themes provides a look into costing trends, future research with a larger sample may enhance further understanding of the costing process and techniques utilized. Also, future investigations using price transparency data and chargemasters to provide costs in life care plans would assist with the evolution of techniques used in life care plan costing.
Conclusion
At the 2017 Summit, attendees requested guidance for life care plan costing, and at the 2022 Summit, attendees requested the development of a Costing Framework for additional guidance when making cost decisions. This project analyzed qualitative responses in the 2021 Survey to identify themes regarding costing techniques that life care planners use to assist with the development of a Costing Framework. This project achieved its goals by gaining insight into techniques used by life care planners in costing decisions and identified themes including aggregated data, individual research, learning techniques, problems encountered (challenges), standards of practice / consensus (majority) statements, and practice management. This project’s findings showed a trend that life care planners use multiple sources or a combination of sources to determine costs, as found by Johnson et al. (2023). However, future research is needed to continue to identify evolving costing trends and variables considered in cost decisions for life care plans.